
Published onONJava.com(http://www.onjava.com/)
http://www.onjava.com/pub/a/onjava/2006/08/16/profiling-with-eclipse-callisto.html
See thisif you're having trouble printing code examples
Profiling Your Applications with Eclipse Callisto
byJohn Ferguson Smart08/16/2006
The latest release of Eclipse (Eclipse 3.2) comes withCallisto, a rich set of optional plugins for Eclipse 3.2. Callisto includes a powerful profiling tool called the EclipseTest & Performance Tools Platform, or TPTP. TPTP provides a comprehensive suite of open source performance-testing and profiling tools, including integrated application monitoring, testing, tracing and profiling functionalities, and static-code analysis tools. Profiling tools are invaluable aids for localizing and identifying performance issues in all sorts of Java applications. In this article, we will look at how you can use TPTP to guarantee high-quality and high-performance code, even during unit and integration testing.
Installing TPTP
The easiest way to install TPTP is to use the Remote Update site (see Figure 1). Open the Remote Update window (Help -> Software Updates -> Find and Install), and select the Callisto Discovery Site. Eclipse will propose the set of Callisto plugins. The TPTP tools are listed under "Testing and Performance." The easiest option, albeit the most time-consuming, is just to install all the proposed plugins. Even if you don't install the entire Callisto tool set, you will still need to install some other components needed by TPTP, such as "Charting and Reporting," "Enabling Features," and "Data Tool Performance."
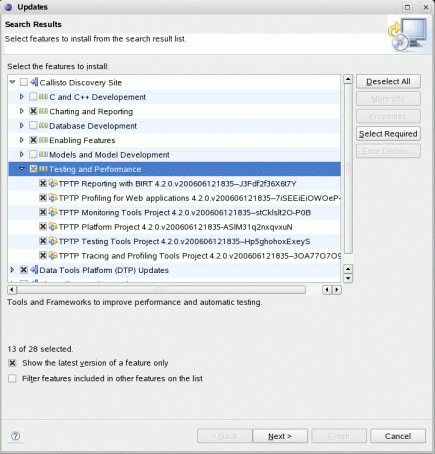
Figure 1. Installing TPTP from the remote site
Profiling a Java Application
The Test & Performance Tools Platform is basically a set of profiling tools. Profiling an application typically involves observing how the application copes under stress. A common way of doing this is to run a set of load tests on a deployed application and use profiling tools to record the application's behavior. You can then study the results to investigate any performance issues. This is often done at the end of the project, once the application is almost ready for production.
TPTP is well suited to this type of task. A typical use case is to run load tests using a tool such as JMeter, and record and analyze the performance statistics using the TPTP tools.
However, this is not the only way you can profile an application with TPTP. As a rule, the earlier you test, the fewer problems you have later. With TPTP, you can profile your code in a wide range of contexts, including JUnit test cases, Java applications, and web applications. And it is well integrated into the Eclipse IDE. So, there is no reason not to start preliminary performance tests and profiling early on.
TPTP lets you test several aspects of your application's behavior, including memory usage (how many objects are being created, and how big they are), execution statistics (where did the application spend most of its time?), and test coverage (how much of the code was actually executed during the tests). Each of these can provide invaluable information about your application's performance.
Despite all belief to the contrary, memory leaks can and do exist in Java. Creating (and keeping) unnecessary objects increases demands on memory and makes the garbage collector work harder, neither of which are good for your application's performance. And if your application is running on a server with long periods of continuous up-time, cumulated memory leakage can eventually cause the application to crash or the server to go down. These are all good reasons to keep a close eye on your application's memory usage.
According to the 80-20 rule of thumb, 80% of performance issues will occur in 20% of the code. Or, in other words, you can obtain substantial performance improvements with relatively little effort by simply concentrating on the areas of the application that are executed most often. This is where execution statistics can be useful.
While it's at it, TPTP also gives you some basic test-coverage data. Although not as complete as a dedicated tool such as Cobertura or Clover, you can still use these statistics to get a quick idea of which methods are being effectively tested by your performance tests.
The sort of testing I'm talking about in this article is not optimization as such. Optimization involves fine-tuning application performance by using techniques such as caching. It is a highly technical activity, and is best done at the very end of the project.
This type of preliminary performance testing and profiling discussed here simply involves making sure that the application performs correctly from the start, and that there are no coding errors or poor coding practices that will penalize performance later. Indeed, fixing memory leaks and avoiding unnecessary object creation is not optimization--it's debugging, and, as such, should be done as early as possible.
Let's start by profiling a single class through some unit tests. You can either profile your normal unit or integration tests, or write more specialized performance-oriented tests. As a rule, you should try to profile code that is as close as possible to the production code. Many people use mock objects to replace DAO objects for unit tests, and it can be a powerful technique to speed up the development life cycle. If you use this type of approach, by all means, run your profiling with these tests; it can reveal useful information about memory usage and test coverage. However, the performance tests are of limited value, as performance in a database-related application is often dominated by database performance, so any serious performance testing should be done in this context. In short, don't forget to profile your integration tests that run against a real database.
For the purposes of this article, we are going to test the following class, which represents a simple interface to a library catalog.
interface Catalog { List<Book> findBooksByAuthor(String name); List<Book> findAllBooks();}The basic unit tests are as follows:
public class CatalogTest extends TestCase { ... public Catalog getCatalog() { ... } public void testFindBooksByAuthor() { List<Book> books = getCatalog().findBooksByAuthor("Lewis"); } public void testLoadFindBooksByAuthor() { for(int i = 0; i < 10; i++) { List<Book> books = getCatalog().findBooksByAuthor("Lewis"); } } public void testFindAll() { List<Book> books = getCatalog().findAllBooks(); }}The first thing you need to do is to set up a profile. Select "Run -> Profile" in the main Eclipse menu. This opens a Wizard in which you can configure different sorts of testing profiles, shown in Figure 2.
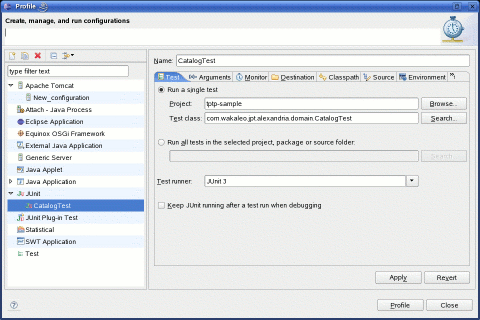
Figure 2. Creating a TPTP profile
In this case, we are interested in the JUnit test profile. Double-click on this entry; the Wizard should create new entries for each of your unit test classes. TPTP is quite flexible, and this screen lets you configure a wide variety of options. For example, in the Test tab, you can either profile unit test classes individually or group them by project or package. The Arguments tab lets you specify runtime arguments, and the Environment tab lets you define environment variables. In the Destination tab, you can specify an external file where profiling data will be saved for future use. But the most useful is the Monitor tab (see Figure 3), where you specify which performance-related data you want to record and study:
- Basic Memory Analysis: This option records memory usage statistics, including the number of object instances and the overall memory used.
- Execution Time Analysis: This option records performance data--how long the application spends in each method.
- Method Code Coverage: This option notes which classes and methods were executed during the tests.
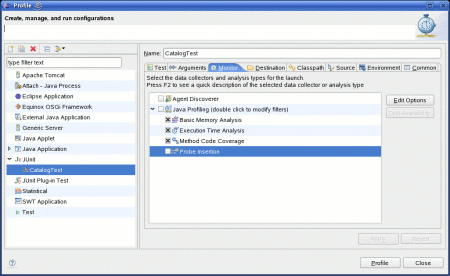
Figure 3: The Monitor tab lets you define the type of data you want to record.
You can either run the profiling tool directly from this window, or using the contextual menu positioned on the test class you want to profile, via the Profile As menu entry (see Figure 4).
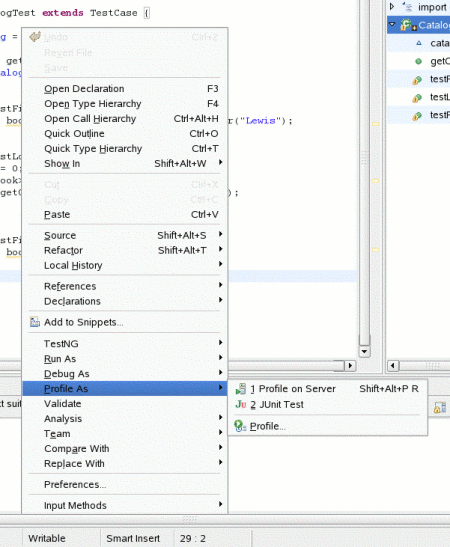
Figure 4: You can launch TPTP profiling using the contextual menu.
The profiling tool may take some time to run, depending on how big your test cases are. Once done, Eclipse will display a Profiling Monitor view, from which you can display details of the results of each type of profiling (see Figure 5).
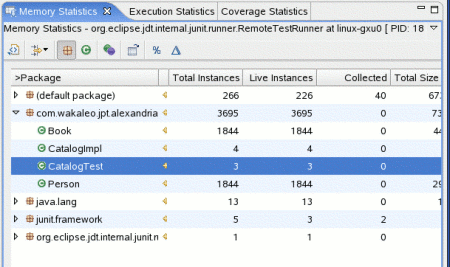
Figure 5: The profile results
The Memory Statistics view displays the number of objects created by the application. The results can be organized by package (in the form of a tree view), or as a list of classes or instances. This data can give you an idea of how many objects of each type are being created; unusually high numbers of created objects (especially high-level objects such as domain objects) should be treated with suspicion.
Another useful tool for detecting memory leaks is the Object References view. To obtain this data, you need to activate reference collecting. After you start the profiling, click on the monitoring entry and select Collect Object References in the contextual menu (see Figure 6). Then open the Object References view via the contextual menu (Open with -> Object References). You will obtain a list of classes with the number of references to each class. This can provide some clues concerning possible memory leaks.
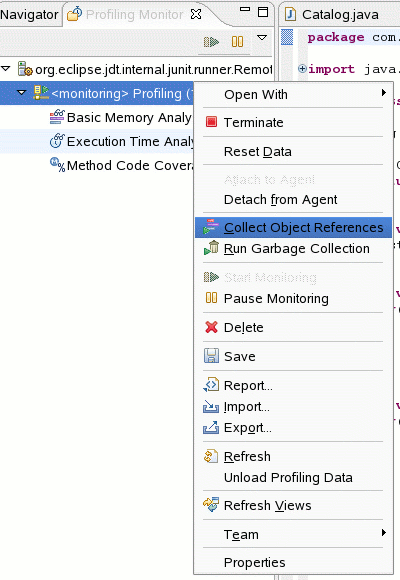
Figure 6: Activating reference collection
The Execution Statistics view, shown in Figure 7, gives a good view of where your application is spending its time. The "organization by" package lets you drill down to the classes and methods that are taking the most time to execute. Clicking on a method will open the Method Invocation Details view, which displays some finer details on the number of times the method is being called, where it is being called from, and what other methods it itself invokes. Although this view is not as well integrated into the source-code views as some of the commercial tools (where it is possible to drill down into the source code itself), it can give some vital clues to which methods may be performing badly.
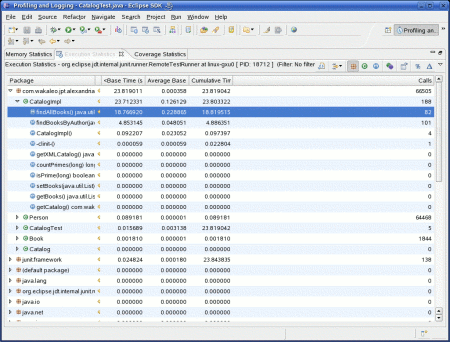
Figure 7: The Execution Statistics view
The Coverage Statistics view (see Figure 8) provides information on which methods were used (and therefore tested, at least to some extent) by the test cases you just ran. The coverage statistics are a nice feature, although they don't provide the same level of detail as dedicated coverage tools such as Cobertura, Clover, and jcoverage, which provide line-precision coverage data as well as statistics on both line and branch coverage. Nevertheless, it does have the advantage of providing real-time coverage results, and currently, only commercial-code coverage tools such as Clover and jcoverage provide both line-level coverage reporting and full IDE integration.
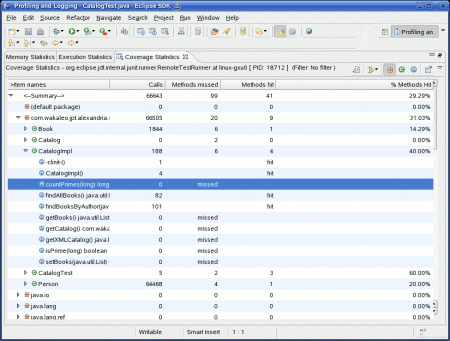
Figure 8: The Coverage Statistics view
Static Analysis Tools
Another interesting item in the TPTP tool box is thestatic analysistool. Java static analysis tools such asPMDallow you to automatically verify code quality by checking it against a set of predefined rules and best practices for the code. TPTP now includes a static analysis tool as well. In addition to providing a set of static analysis rules of its own, this tool is designed to provide a consistent interface in which other tool vendors can integrate their own rules.
To run static analysis on your code, you need to create an analysis configuration. Open the Analysis window using the contextual menu in the Java view or the Analysis icon, which should now appear on the toolbar (see Figure 9). An analysis configuration determines what code will be analyzed (Scope), and what rules should be applied (Rules). There are 71 rules to choose from, such as "Avoid casting primitive types to lower precision" and "Always provide a break at the end of every case statement." You can also use predefined rule sets such as "Java Quick Code Review" (in which only 19 of the 71 rules are applied).
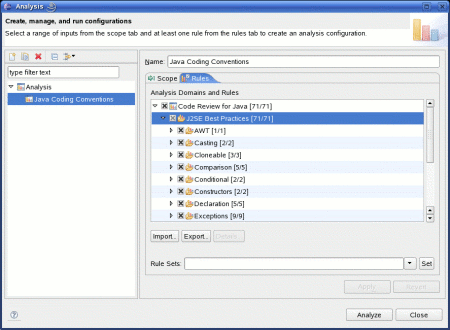
Figure 9: Setting up static analysis rules
To analyze your code, use the Analysis icon in the toolbar. Analysis isn't done in real time, as it is with some of the other similar tools such as Checkstyle. However, the results are clearly presented (see Figure 10): errors are bookmarked in the source code view and listed in the Analysis Results view in a tree view organized by error type. One neat feature is the "Quick Fix" option, which appears in the contextual menu over certain error types, and which proposes, if possible, to automatically correct the problem for you.
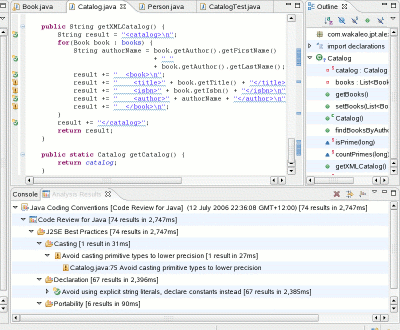
Figure 10: Static code analysis results
Conclusion
The Eclipse Test & Performance Tools Platform is a valuable addition to the Eclipse IDE toolkit. The wide range of performance testing it allows will help you to guarantee high-quality and high-performance code right from the first unit tests.
TPTP is certainly not as developed as some of the commercial tools available such as OptimizeIt and JProbe, which often have more sophisticated reporting and analysis functionalities, and a more polished presentation. However, commercial profiling tools tend to be notoriously expensive, and it is often difficult justifying their use in all but the most dire of circumstances. Although it is still relatively young, TPTP is a powerful and capable product, and can certainly provide valuable profiling data that many projects would otherwise have to do without.
Resources
John Ferguson Smarthas been involved in the IT industry since 1991, and in J2EE development since 1999.
Return toONJava.com.
Copyright © 2006 O'Reilly Media, Inc.
//-->'Eclipse' 카테고리의 다른 글
| 뷰 연결로 Eclipse 애플리케이션을 더욱 풍부하게! (0) | 2006.09.07 |
|---|---|
| Eclipse RCP: A Platform for Building Platforms (0) | 2006.08.30 |
| Integrating Swing into Eclipse RCPs (0) | 2006.06.18 |